Prototype Roundtable Notes

This is what we told our critics:
Our aim is to motivate people to ride bikes.
Our hypothesis is that when you can see where you have been on a map, you will be inspired to go more places.

Our value for the individual is making a record of your life on a bike. If you have friends on the platform, the value added is to compete, be inspired, or collaborate on a map. We also shared with them our working prototype.

The feedback we received:

FROM PAUL PANGARO
“It’s both a 1 person video game and a 2 person video game” – Cooper
If it’s about comparing, what choices are you making about how you are showing comparisons—what mechanisms are you using
Ex: velocity vs. acceleration (velocity is how fast you are going, but acceleration is the rate at which you are increasing)—If I’m beating Kristin, at what rate am I beating her; can I compare how well I’m beating her this week to last week?
We should be able to say “I chose this because…”

FROM FRANK CHIMERO
The overlap is interesting
Is it about documentation or being inspired?
How are we incentivizing people?
Typography on maps
Documenting vs. information
- how do you make the data information
- contextualize it
Tell a few stories of how it’s used

FROM AMIT PITARU
What makes people want to keep coming back to use it?
TAKE A WORLD VIEW
“See your snazzy patterns emerge on a map” is not enough —amit
Is it only about seeing?
self-expressing
- it’s telling you where you have been in your city and how often you ride; it says something about you
Your bike habits say something about you.
What we’re making: Uses the rides you take on a bike as a form of self expression.
- How do people react at a party?

Charts & Graphs in HTML 5

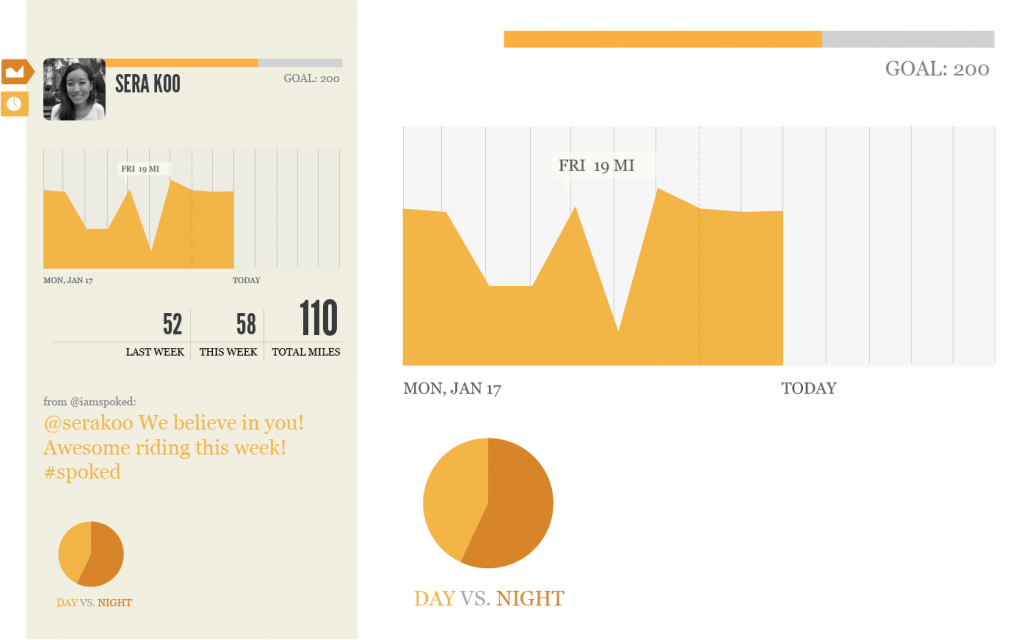
Along with showing your snazzy bike patterns on a map, we’ll give riders extra insight into their habits with beautiful charts and graphs. I’ve been doing research as to how we can make these using the HTML 5 canvas element and Javascript libraries.

Recently, I thought we should use g.raphel javascript library. From the looks of it, you can draw vector graphics in the browser! That’s pretty exciting, right. The problem is that, while there is documentation, there’s not any tutorials to get us started. So, I began to look into other options.

We can actually draw pie chart and line graphs within the canvas element without needing a plugin or javascript library. Here are a few good tutorials for getting started:

Creating Line Charts using HTML 5 Canvas from Weblogs.
Draw Line Graph using HTML 5 Canvas from World Wide What
Create a simple pie chart with HTML 5 Canvas from Yojimbocorp
How to Make a Pie Chart from Wickedy Smart

The two additional options I recommend are using processing.js, which we are familiar with, or PlotKit, which is a chart and graph plotting library for Javascript that is very well documented.

Under Construction, v.1

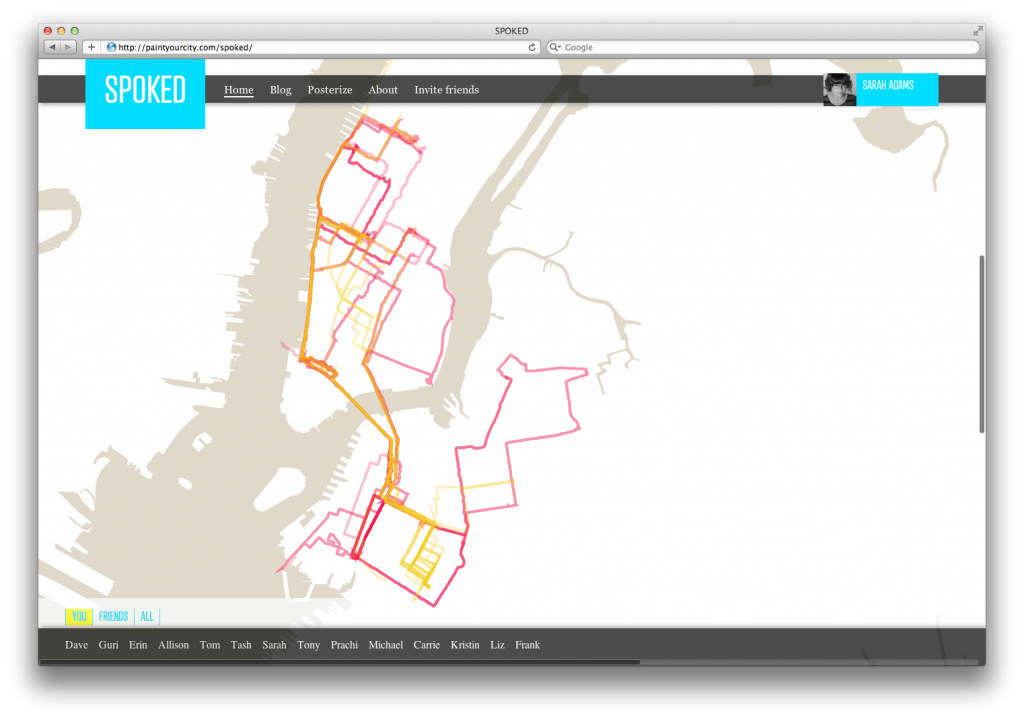
Our project is coming along! We are currently coding up the front-end using HTML, CSS, and Processing at paintyourcity.com/spoked. The rides you see on there are our recent rides drawn in Processing. Carrie is pink, I’m yellow. We’re battling with colors. Yeah! However, these rides are currently pulled from a static files.

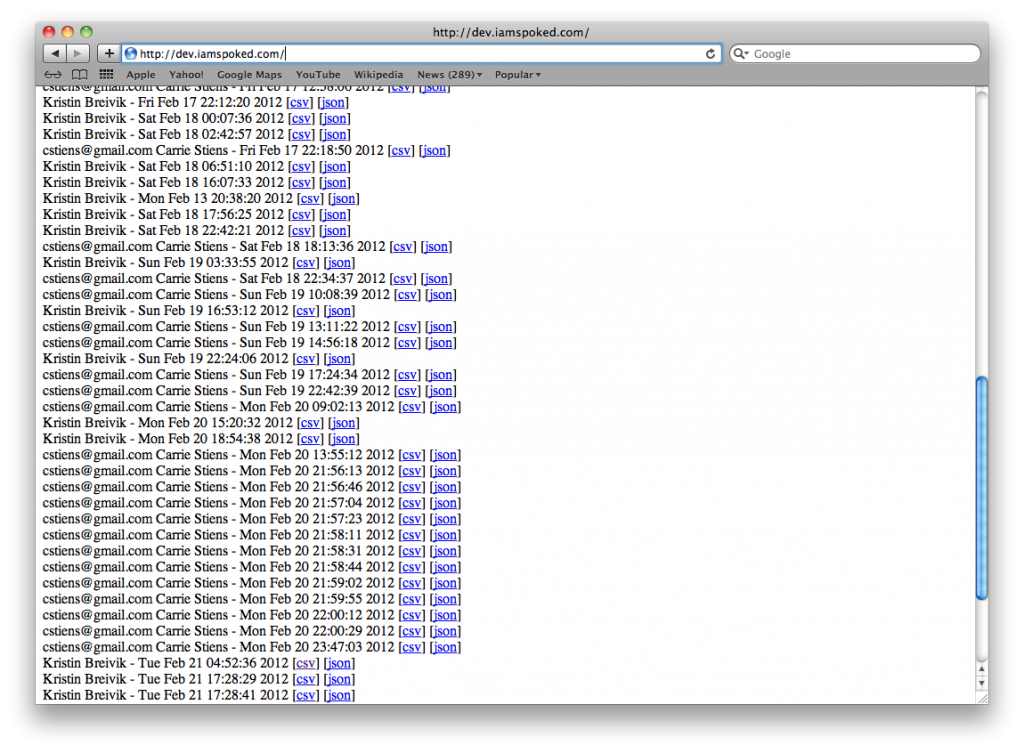
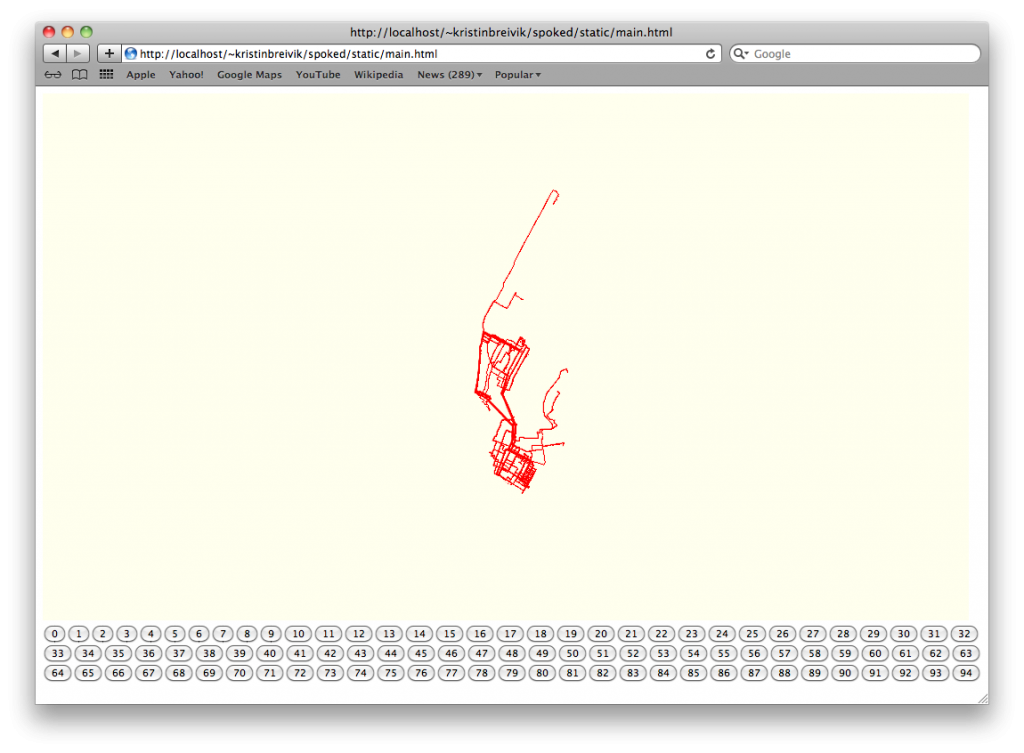
Our awesome developer buddy Yang Yang has written some scripts and done other developer magic to pull all our rides from an email account into a database. Above you can peek into our data. Below you can see the first attempt to visualize our data directly from the database:

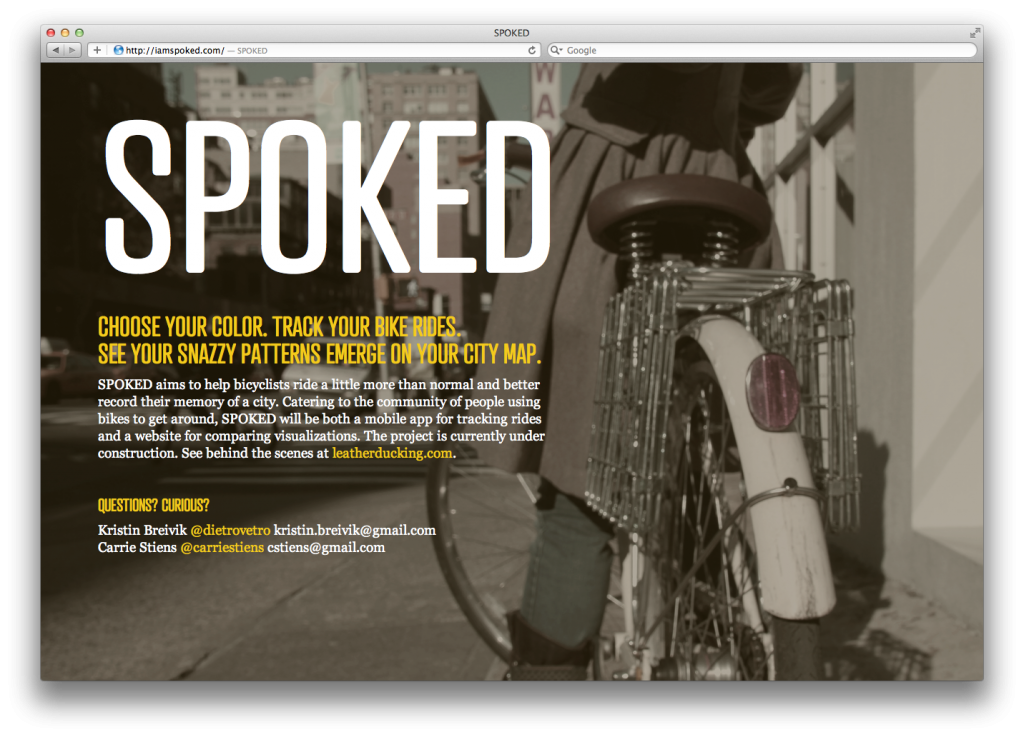
And finally, we have a splash page up at http://iamspoked.com. The model has such a beautiful bike. But shame on that girl for riding on the sidewalk!

Tracking Instructions MotionX

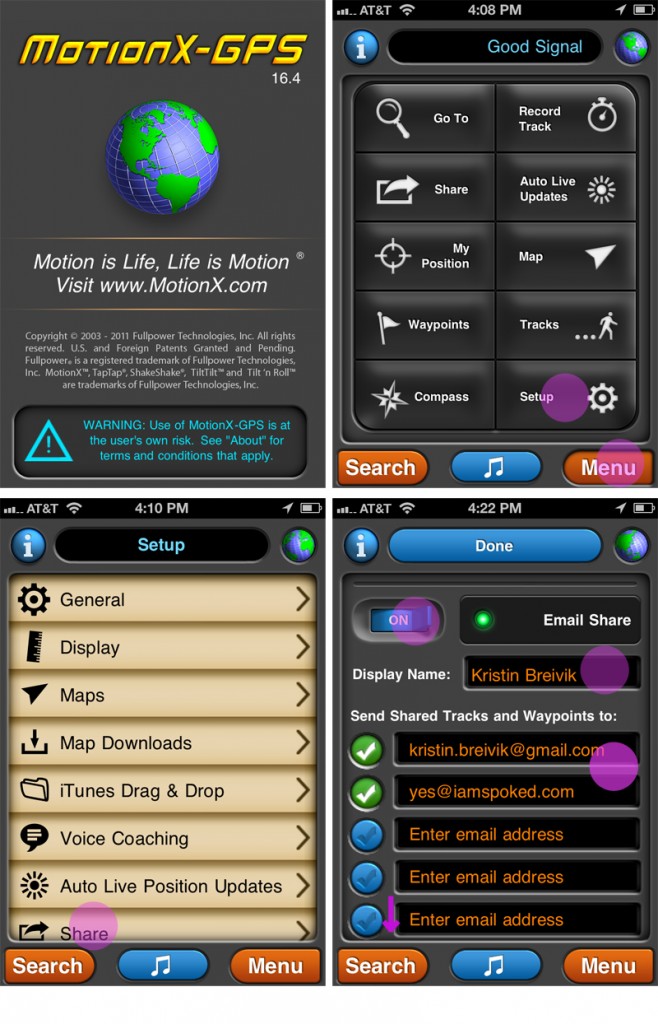
If you want to contribute your rides to our SPOKED platform, please get MotionX for the iPhone. We chose this because it is the easiest app for sharing your rides with us on SPOKED right now. Below follows instructions for setting up MotionX, and how to track your rides.

SHARING SETTINGS: Menu > Setup > Share

1. Scroll down to Email share.

2. Set Email Share switch to ON.

3. Write your Display name: Firstname Lastname

4. Send to: yes@iamspoked.com

5. To keep track of whether or not you have shared all rides, you could add your own email address too in another field.

6. Set One-Click share to ON. Then you can easily hit the Share button after you biked, and your data will be sent to SPOKED immediately.

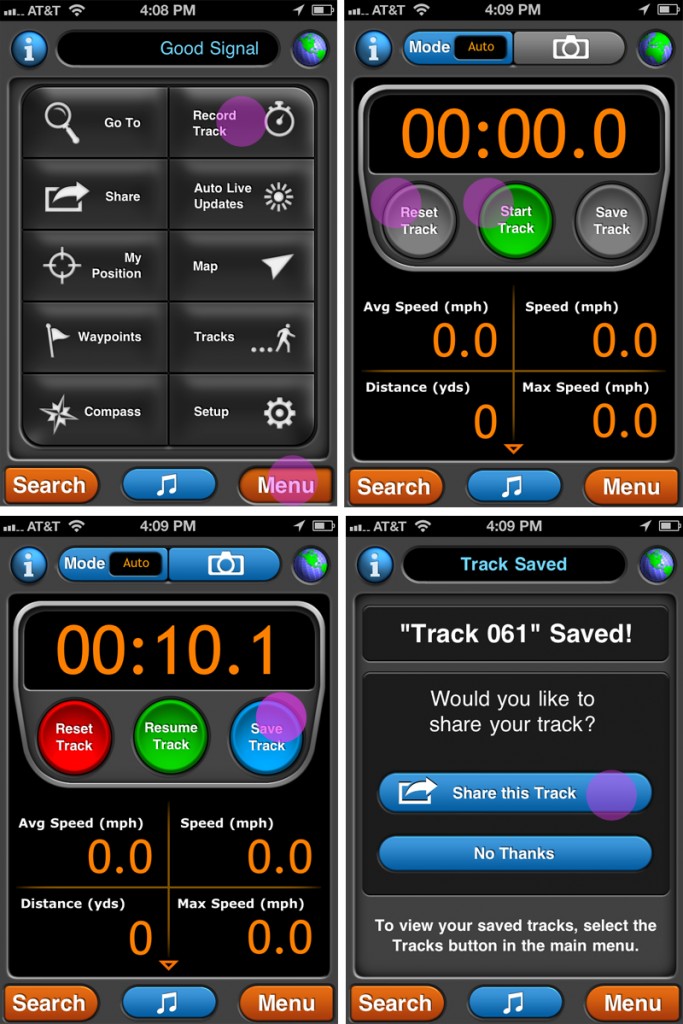
TRACK RIDES: Menu > Record track

1. Hit Reset track if you have previously tracked a ride, to make sure you start at 00:00:00.

2. Hit Start track. This typically needs to happen when you’re outside so the phone has GPS signal – when globe is blue & green.

NOW RIDERIDERIDE!

3. Pause track when you’re at your destination.

4. Save track

5. Share track. With the click of one button the ride will be shared with SPOKED and your own email account if you provided that in the setup.

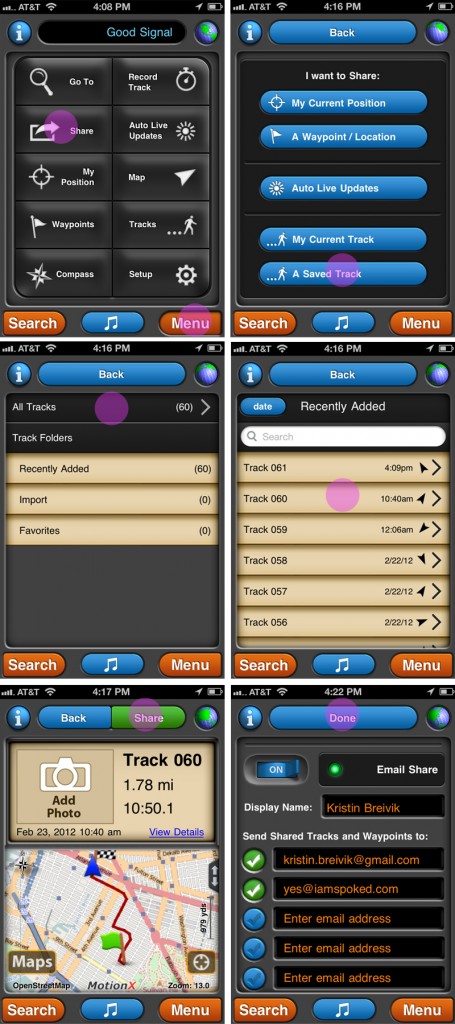
ACCESS YOUR RIDES: Menu > Tracks

Please try to share your rides immediately after you stop tracking. But if you forget, you can share a track from Menu > Tracks, or Menu > Share:

VOICE COACHING: Menu > Setup > Voice Coaching

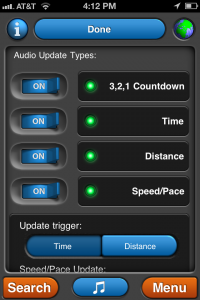
Depending on how often you want this sexy woman to update you on your pace etc, change settings here. The 3,2,1 countdown is kinda entertaining, so leave it on if you want to feel like a rocket ready to launch every time you jump on your bike!

Tracking Instructions Google My Tracks

You don’t need to pre-set anything for My Tracks. Just be sure to send from the right email address, once you start sending rides. Also, there are a few steps to go through to send the ride data to us. See below.

TO START TRACKING:
Press Menu “Record track”

TO STOP TRACKING:
Press Menu “Stop recording”

TO SHARE:
1. Press the … button
2. (Under This track) Select “Share with friends…”
3. (Under Share with friends) Select “A GPX file”
Google will tell you this will take a while
4. (Under Share track using:) Select Mail
Be sure to send the email from the email address you gave SPOKED when you signed up. If it’s not the same, press “From: ” and select the correct account to send from.
5. Send email to: yes@iamspoked.com
You don’t need to change anything in the subject or body, just press “Send”.
That’s it. Easy Peasy!

Let’s talk about the weather

I personally think that biking in the rain is pretty awesome – I can sing and nobody hears me, I can bond with the few bikers that are actually out there, and I can verify that my rain pants was sooo worth paying a fortune for. However, I still care about knowing what the weather will be like. I’d also love to see some stats on how many times I actually jump on my bike seat even though water falls from the sky. Weather impacts the ride tremendously, whether it’s pouring down or the sun is shining. We might want to add weather information to our service in some way. That’s why this link here might be important:

http://blog.programmableweb.com/2010/02/08/googles-secret-weather-api/

We’re SPOKED!

Two pieces of news from us to you. The amazing Yang Yang (developer at Turntable) has agreed to help us develop a prototype for our thesis. That is the greatest news. On top of this, we now know what our thesis-social-tracking-platform-product-service-movement-thingy should be called. It’s called SPOKED. So now we can call it by its short name rather than the confused long one. The domain is iamspoked.com, because we unfortunately do not have $50,000 to spend in a GoDaddy domain auction :/ Oh well.

The name came about through collaboration with a lot of people. However, we definitely need to thank the creative brain and our studio’s systems administrator Frank Bonomo, as well as our very helpful and brilliant classmate Tina Ye. Yeah!

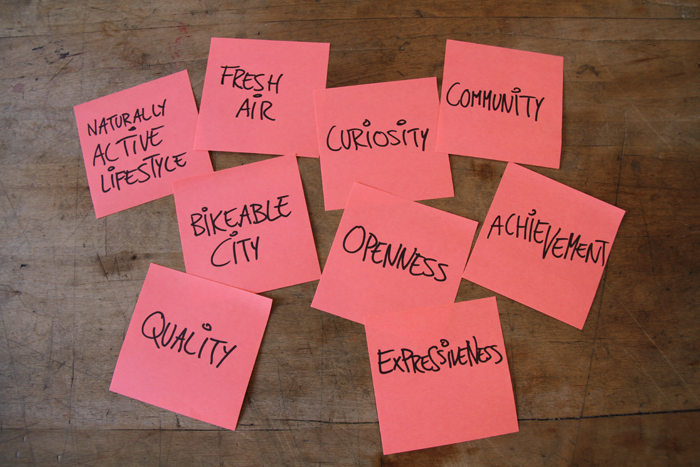
Values

NATURALLY ACTIVE LIFESTYLE
Having physical activity worked into a busy day without carving out extra time

FRESH AIR
Being outside and experiencing the environment and nature

CURIOSITY
Freedom to act on my curiosity, explore and experience new places

EXPRESSIVENESS
I express my image in the things that I wear, the products I use, and I like to create and document my life

COMMUNITY
Sharing the things that make me happy with my friends and being connected to something bigger than myself

ACHIEVEMENT
Making progress and getting better at the things I do

BIKEABLE CITY
Having a bike-friendly city and the feeling that I am doing my part to make the world a healthier place

QUALITY
Good design and quality products. Care about

OPENNESS
Independence and transparency

Thoughts in Progress: Values, Tech, Splash Page

Our thought progress after meeting with Willy on February 2, 2012:

VALUES OF OUR RIDERS
1. Altruism & Social Good
selfless concern for the welfare of others

2. Naturally Active Lifestyle
healthy lifestyle, efficiency
“We bike, of course”

3. Adventure & New Experiences
openness to new places and things
love for a place, hunger for life
“Life’s too short for monotony”

4. Connecting with People
sharing life and lifestyle

5. Expressiveness & Creativity
having style
good design, quality products

6. Independence
free of systems and institution

BACKEND TECH
- automate data transfer from email to server
- parse data for processing
- activate processing to render
- display various views: aggregated, groups, individual
- compile stats (ex: distance, time spent riding, neighborhoods covered)
- map views (Brooklyn, Bronx, Manhattan, Staten Island, Queens)
- twitter feed
- notifications for achieved milestones (ex: riding 100 miles, riding for consecutive days, tracking, coloring hoods) and needed encouragement (ex: not riding)

SPLASH PAGE
Name
Tagline
Short Description

1. Choose your color
2. Bike Persona
- Neighborhood Warrior
- Casual Commuter
- Committed Commuter
- Strictly for Pleasure (Leisure Rider)
3. Reserve username with Twitter (or leave email)

BLOG
- Want 6-10 stories by May based on interviews with bikers
- Get a photo of bikers
- Choose meeting points for each biker
- Tie string on handlebars
Interview Questions:
- Tell us about the places you go on your bike (favorite, where you meet people, latest ride)
- What is your take on weather
- Do you try to get your friends to ride?
- Any strange encounters?
- Goals?

Thesis Advice, v.1

“Ambitious: (of a plan or piece of work) intended to satisfy high aspirations and therefore difficult to achieve.”

While ambitious describes us pretty well, Kristin and I have been both lucky and blessed to have a handful of advisors on our thesis project. Between five consultation meet-ups, we’ve been exposed to many different approaches for the next 3 months that could lead to very different ends (or milestones) in May. While our brains have flooded with the possibilities, below I’ve called out the sticking points.

THE MYTH OF OUR PLATFORM
Advice from Willy Wong
Two of the most important things we can do with our thesis project is to sell our idea, and to sell the lifestyle of biking. Manufacturers of lotion believe that if you just try the product once, you will love it so much that you will keep buying it. If we get people to bike once, is that enough to keep them biking?

Willy encouraged us to think about what the front page of the site looks like on day 1, versus day 2, versus day 4, versus one week later, and so on. What exactly does the service do from the initial sign-up to keep a rider engaged and motivated to ride? And how do we continue to keep people engaged once they’ve hit a plateau and are bored of tracking?

We’ve started to explore a 2-week challenge model, with the option to continue tracking and visualizing bike rides afterward. In this case, our primary user base would use the service like a ‘training program’ for two weeks to get in the habit of riding a bicycle for transportation. We suspect that a few advanced users, mostly data enthusiasts, quantified self fans, or committed storytellers, would use the service long-term.

But, the question remains: how do we get people to exclaim, ‘I can’t live without this’? How do we get people addicted to biking and addicted to telling their story by painting their city on two wheels? What do we tell them?

Willy has poked holes in our concept and given us tips and frameworks for getting started with branding and moving forward with user experience and concept development.

OPEN DATA FOR GOOD, NOT EVIL
Advice from Amit Pitaru
Amit encouraged us to take a strong stance on our world view in regards to data—OPEN: our users have complete ownership over their data; or CLOSED: we sell the data to large companies for marketing. Both models are viable and are being used by businesses today. Though, we mainly discussed the possibility of having an open source model. Analogues include OpenPhoto (openphoto.org and openphoto.me) and WordPress (wordpress.org and wordpress.com). With both of these, there is a side to the model that offers a service, and a side that is open for developers to build their own service upon using their own data and coding skills.

We believe in data for good. Our users should own their own data. In addition, we see a lot of power in using the mapped riding data to advocate for biking and to show NYC DOT where to paint bike lanes. Regardless of how we set up our business model, we value data ownership with the option to share anonymously for the public good.

TRACKING AND FUSION TABLES
Advice from Robert Carlsen
We met with Robert Carlsen, the developer of Mobile Logger, a tracking app for bikers. He developed the app as a part of his thesis at ITP nearly two years ago. Needless to say, he understands the joys and decisions involved with graduate thesis projects.

We were (and still are) impressed with his work, and were excited about the possibility of building of top of his open-source tracking platform. It’s funny that his first recommendation was to ‘not use Mobile Logger’. Not because he didn’t want to share, but simply because it’s two years old and he believes there are much better ways for developing a tracking app now.

In short, we have options for development—some including the Mobile Logger and some excluding it. However, rather than building the entire platform (tracking app and web platform) right away, we’ll first focus on an initial prototype for testing the idea within our short 3-month time period. After meeting with Robert, we’ll look into how Google Fusion Tables can help us collect and store data as well as other iphone tracking apps.