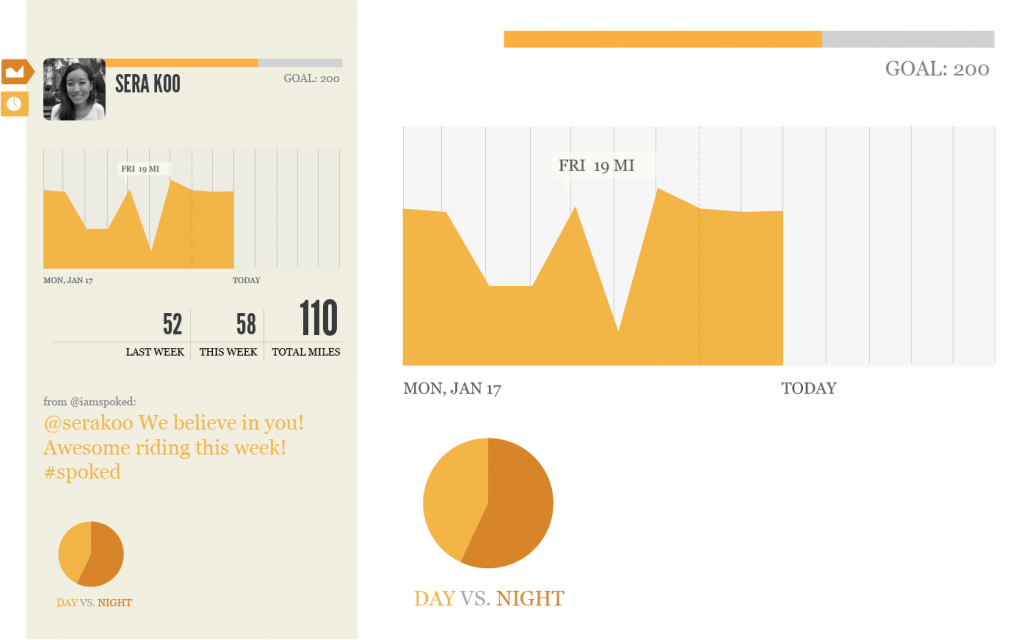
Along with showing your snazzy bike patterns on a map, we’ll give riders extra insight into their habits with beautiful charts and graphs. I’ve been doing research as to how we can make these using the HTML 5 canvas element and Javascript libraries.
Recently, I thought we should use g.raphel javascript library. From the looks of it, you can draw vector graphics in the browser! That’s pretty exciting, right. The problem is that, while there is documentation, there’s not any tutorials to get us started. So, I began to look into other options.
We can actually draw pie chart and line graphs within the canvas element without needing a plugin or javascript library. Here are a few good tutorials for getting started:
Creating Line Charts using HTML 5 Canvas from Weblogs.
Draw Line Graph using HTML 5 Canvas from World Wide What
Create a simple pie chart with HTML 5 Canvas from Yojimbocorp
How to Make a Pie Chart from Wickedy Smart
The two additional options I recommend are using processing.js, which we are familiar with, or PlotKit, which is a chart and graph plotting library for Javascript that is very well documented.


