A Story to Tell

In a few short weeks, we will present our thesis project to a very large crowd of people! We need a story to tell that will compel them to listen to us, whether they love biking, or have no idea what it means to ride a bike. Here’s a second shot at our story:

kb: Do you see this hill?
Of course you understand why I left my bicyle at the bottom.
Hi, I’m Kristin. This was the hill I faced everyday in Oslo before getting home from work.

cs: Hi, I’m Carrie.
My pink bike arrived in New York nearly a year ago. And yes, even though New York is very bike-able, I was terrified when I rode it home from the bike shop in the East Village.

cs: Riding a bike in a city has it’s hurdles. I’m lucky because I’ve had Kristin to dare me to do things, that I once considered crazy… like commute 14 miles every day from brooklyn to manhattan.

kb: I will confess, I have the tendancy to try to get people in on things that I know I can’t do on my own.
cs: and I will naively say yes to any (almost any) challenge

cs: We began on our bikes, simply riding to the coffee shops in our neighborhood that were hard to get to with the subway. But before long, this minor habit became our lifestyle.

kb: Because regardless any hurdle, riding a bike sets me free and fills me with fresh air. It makes me happy.

cs: Being dared to go further, or even just getting a taste of riding a bike, will make you happy! I’ve seen it with my very own eyes, and felt it with my very own emotions.

cs: So, we’ve spent the last 9 months, trying to find ways to get people riding bicycles. Today, we’ll tell you about the service we’ve created to do this: SPOKED.

kb:SPOKED is your way to get your friends and co-workers to feel the happiness from riding a bike. (Because we’re only two people, and want to spread the happiness of biking far and wide.)

More ideas in Story Notes.

Can we borrow bikes, please?!

Twelve excited interaction design students are ready to get their game on when we launch the very first SPOKED two-week competitive game spree on Monday. Problem is that we lack a few bikes…

Tina (@tinabeans), Benjamin (@bgadbaw), Prachi (@prachipun) and Christine (@cayanna) got totally SPOKED about biking when we announced the launch. They even picked out their color to paint the city streets! Unfortunately they don’t own bikes. Yet. We secretly hope that if they get the taste of the NYC bike life during our two-week game, they’ll be bike-owners in no time, and SPOKED forever.

Can you help them out, so we can get as many wheels rolling as possible? Get in touch with them or us (Carrie and Kristin) if you can!

SPOKED? WHAT ARE WE TALKING ABOUT?
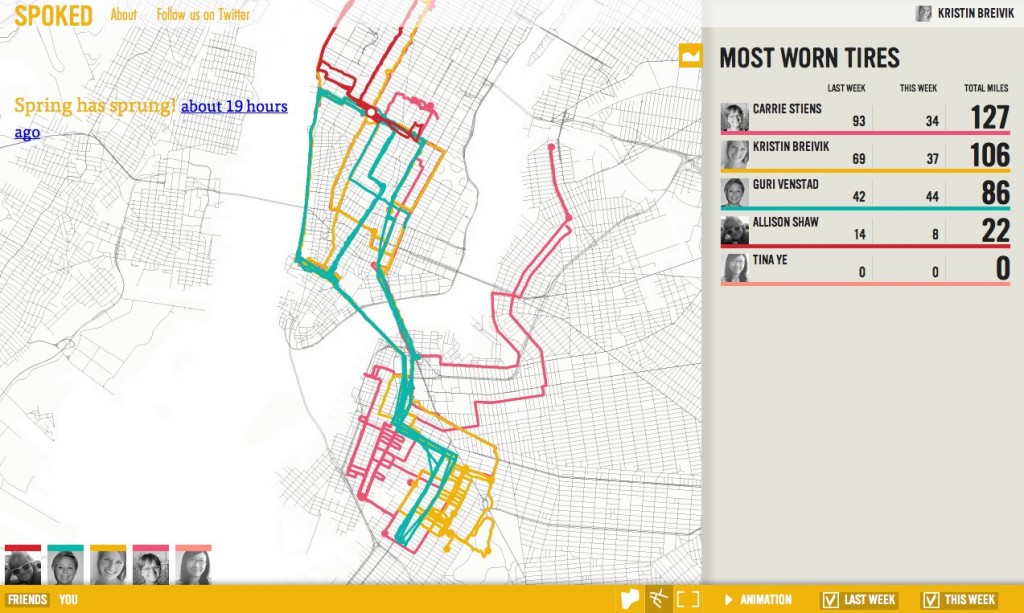
We honestly believe that people that ride bikes are happier. They are beautiful inside and out, because there’s really no limit to what fresh air can do to a person. This is why we have created SPOKED – a service that helps you build bike cultures among your workplace and friends. Here’s a snapshot of the web interface, and a tiny circle of bike friends:

When you’re playing a SPOKED game, by tracking your rides with a smart phone, you get to make snazzy patterns on a map with the color of your choice. You get to share the patterns and feel the wonderful social pressure by people around you to bike a little more than usual. You’ll also get encouraged in the currency “smiles” to bike consistently, and nudged on twitter when your bike is calling for you to get on the streets. Most importantly, you get to take part of a little two week adventure that just might change your lifestyle forever!

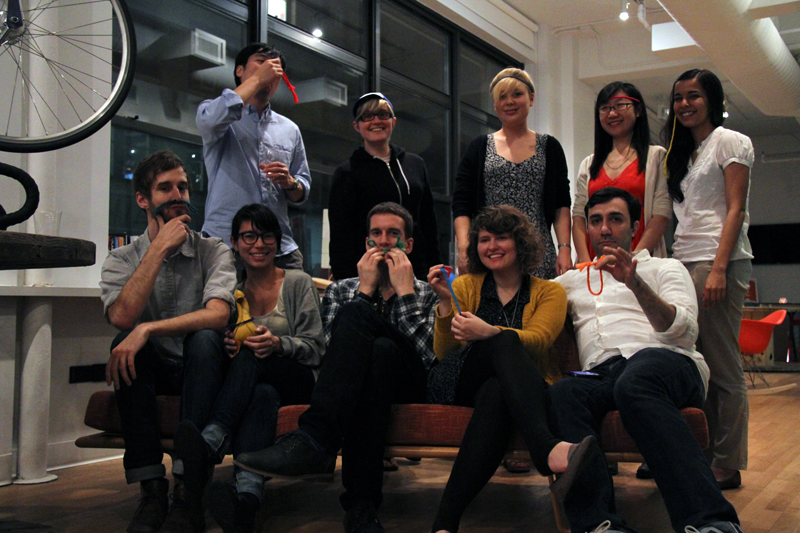
Here’s most of the SVA IxD SPOKED team just after they got their color, prepared to bike and collect the most “smiles” starting Monday (3/26):

Follow us @iamspoked!

Under Construction, v.2


Oh yes, our SPOKED site is seriously good-looking right now! We’re spoked and proud that we have a working thing. We owe all database and javascript magic to Yang Yang. We’re also super happy that a few of our classmates jumped in to donate data to us. It’s very valuable to have more rides than just mine and Carrie’s when figuring out how to visualize and animate the rides. Thank you to Allison, Guri and Tina for tracking rides and sending them into a black hole. Hopefully our developing cocoon will very soon become a colorful butterfly for all to see :)


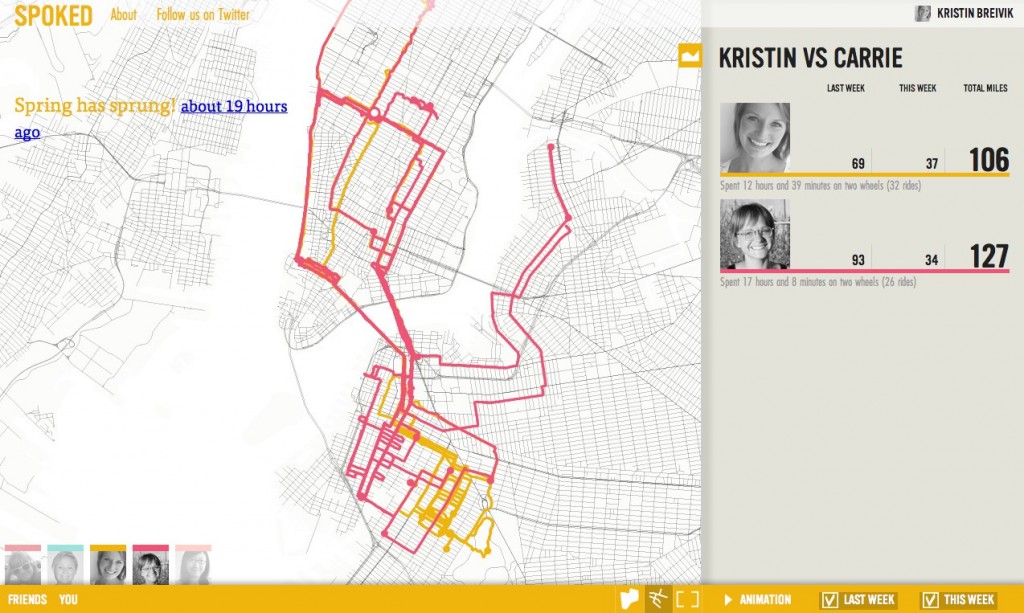
We’ve developed different views when looking at the map. You can go to a certain profile, or you can see one person’s rides versus someone else’s, like above. Yes, Carrie is beating me. Arrgh.


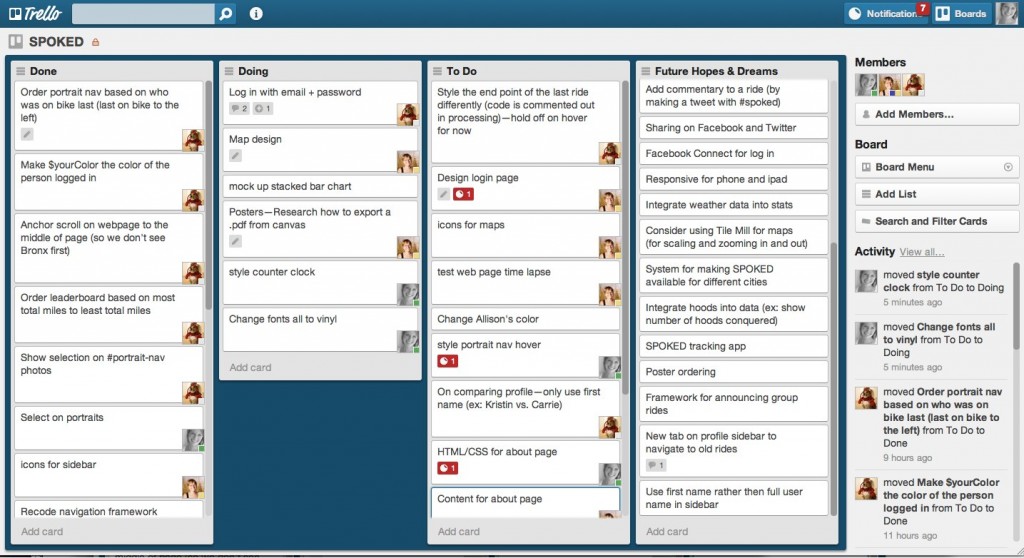
We’re using the most amazing organization and collaboration tool, Trello. Totally addictive. So very satisfying to move the cards from To do to Doing to Done. And I think it’s even moving us forward in our process. So that’s good.


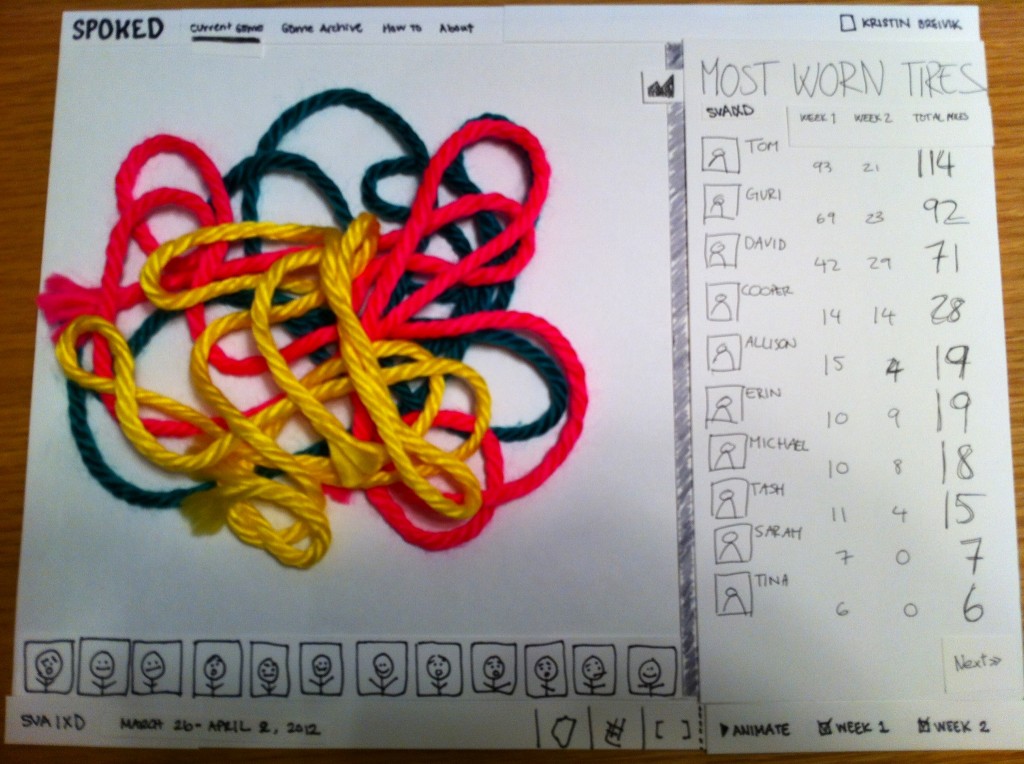
One would think that when we’re that deep into code, there’s no turning back. But there is. Sometimes, when new features add complexity, we need to use paper and yarn to make sense of it all. Does it make sense now? We hope so. Cause we’re launching a prototype test very, very soon.

Let’s focus on what we know

We have come to a point of needing to clarify what we’re making and how it’s achieving our goal. After having spent months in developing the minimal features, we have an MVP that could be framed in multiple different ways.

From research and conversations with bikers, we know that most people start to get into the habit of biking under some kind of social pressure either from a friend, co-worker or culture of a place. For example:

Mark joined the taco tour as an excuse to get back on his bike again after falling out of habit.

Julie bought a bike when she moved to a neighborhood where a lot of people ride bikes.

Our goal is to help busy people get into the habit of riding for transportation. Why? Because we believe that biking brings joy to your life!

Our intention is to create a social event that gives people an excuse to ride and pushes them to dare to go further than usual. Competition, recognition and contribution to a communal goal will push people. Thus, SPOKED is a service for people to self-organize competitive spurts of biking so that they can push themselves and each other to ride more than usual for a constrained 2-week period of time. Our audience includes avid bikers, casual bikers, and dusty bike owners.

We believe that it’s not necessarily about miles, but the pure act of getting on a bike over and over that will get people into the habit. Practice makes perfect.

A look back at our from the fall helped bring clarity to what we’re making:

Goal: Our goal is to get people excited and curious about biking, and to provide a way for people to encourage each other to use their bike more for getting around the city.

Rationale: We will achieve this by giving the user voluntary challenges (initiated by self, friends or their workplace) to push themselves to bike more as well as recruit others to get on their bikes. We are providing consistent feedback on their progress, and enhancing the in-ride experience.

The Bike Pen

Our prototype is coming along, and we’ve showed it to a few people lately. Faculty members Paul Pangaro, Frank Chimero and Amit Pitaru along with our fellow classmates gave us a lot of valuable feedback. They made it clear to us that while it’s cool that we have this prototype, it needs to have a distinct world view. What do we want people to do with it? Bike more? Bike different? Discover new places? Bike together? Just draw patterns?

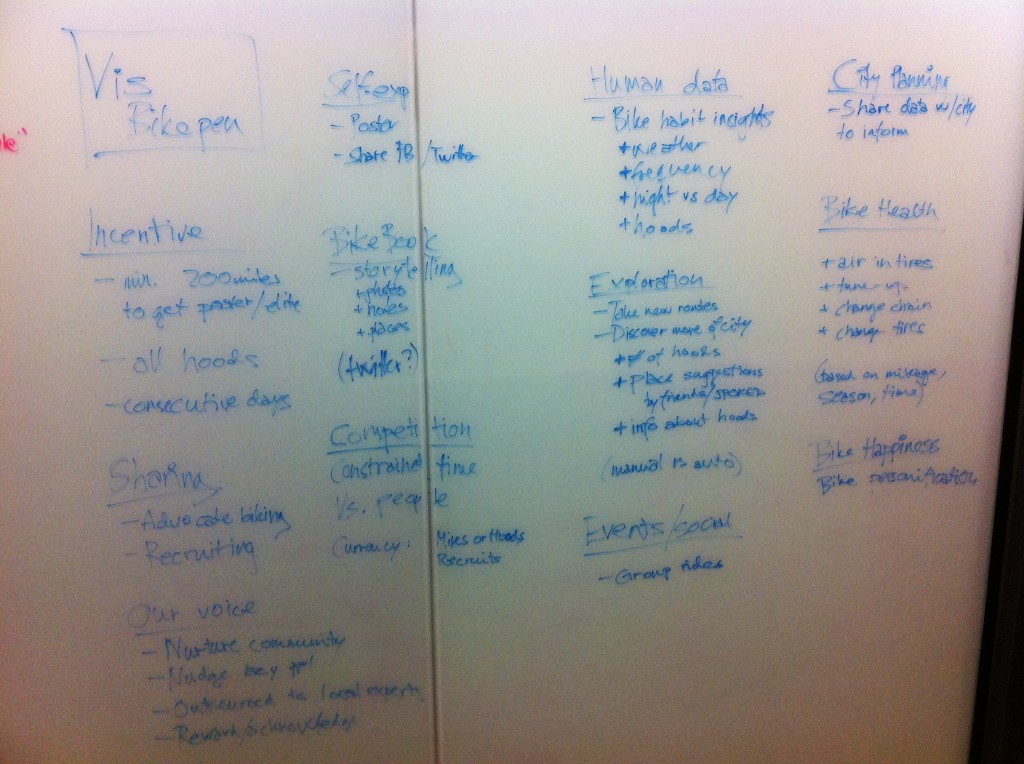
As our thesis advisor, Willy Wong, said: “So, you’ve made a bike pen…” He then suggested that we should just get it out there, see who uses it, how, and so on. We definitely want to get it out there, and we will! But we still felt there was this missing part, and had a longer brainstorm whiteboard session to find our world view:

The image displays our possible directions when we try to go from Bike Pen to something more:

INCENTIVE
- to get poster and/or become elite etc
- minimum 200 miles unlocks …
- visit all hoods unlocks …
- number of consecutive days riding unlocks …

SHARING
- advocate biking
- recruiting

OUR VOICE
- nurture community
- nudge laxy people
- outsource to local experts
- reward/acknowledge

SELF-EXPRESSION
- poster
- share on facebook/twitter

BIKEBOOK
- storytelling (photos, notes, places). Twitter/Facebook

COMPETITION
- constrained time
- versus people
- currency: miles or hoods or number of recruits

HUMAN DATA
- bike habit insights
(weather, frequency, night vs day, hoods)

EXPLORATION
- take new routes
- discover more of the city
(number of hoods, place suggestions by friends/SPOKED, info about hoods)

EVENTS/SOCIAL
- group rides

CITY PLANNING
- share data with city to inform

BIKE HEALTH
- air in tires
- tune-up
- change chain
- change tires
based on mileage, season, time

BIKE HAPPINESS
- bike personification
- “joymeter”

Prototype Roundtable Notes

This is what we told our critics:
Our aim is to motivate people to ride bikes.
Our hypothesis is that when you can see where you have been on a map, you will be inspired to go more places.

Our value for the individual is making a record of your life on a bike. If you have friends on the platform, the value added is to compete, be inspired, or collaborate on a map. We also shared with them our working prototype.

The feedback we received:

FROM PAUL PANGARO
“It’s both a 1 person video game and a 2 person video game” – Cooper
If it’s about comparing, what choices are you making about how you are showing comparisons—what mechanisms are you using
Ex: velocity vs. acceleration (velocity is how fast you are going, but acceleration is the rate at which you are increasing)—If I’m beating Kristin, at what rate am I beating her; can I compare how well I’m beating her this week to last week?
We should be able to say “I chose this because…”

FROM FRANK CHIMERO
The overlap is interesting
Is it about documentation or being inspired?
How are we incentivizing people?
Typography on maps
Documenting vs. information
- how do you make the data information
- contextualize it
Tell a few stories of how it’s used

FROM AMIT PITARU
What makes people want to keep coming back to use it?
TAKE A WORLD VIEW
“See your snazzy patterns emerge on a map” is not enough —amit
Is it only about seeing?
self-expressing
- it’s telling you where you have been in your city and how often you ride; it says something about you
Your bike habits say something about you.
What we’re making: Uses the rides you take on a bike as a form of self expression.
- How do people react at a party?

Charts & Graphs in HTML 5

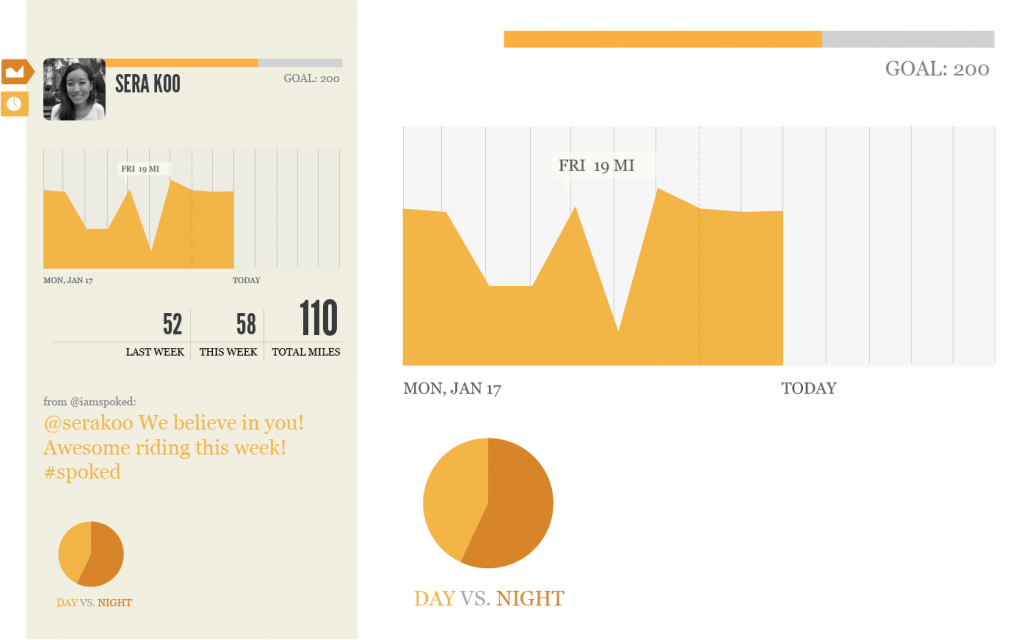
Along with showing your snazzy bike patterns on a map, we’ll give riders extra insight into their habits with beautiful charts and graphs. I’ve been doing research as to how we can make these using the HTML 5 canvas element and Javascript libraries.

Recently, I thought we should use g.raphel javascript library. From the looks of it, you can draw vector graphics in the browser! That’s pretty exciting, right. The problem is that, while there is documentation, there’s not any tutorials to get us started. So, I began to look into other options.

We can actually draw pie chart and line graphs within the canvas element without needing a plugin or javascript library. Here are a few good tutorials for getting started:

Creating Line Charts using HTML 5 Canvas from Weblogs.
Draw Line Graph using HTML 5 Canvas from World Wide What
Create a simple pie chart with HTML 5 Canvas from Yojimbocorp
How to Make a Pie Chart from Wickedy Smart

The two additional options I recommend are using processing.js, which we are familiar with, or PlotKit, which is a chart and graph plotting library for Javascript that is very well documented.