Concept & Branding

STYLE GUIDE ELEMENTS
title
logo
tagline (baby)

service offering
copy nuggets (commentary)
- weather
- how you’re doing
- what your friends are doing
- neighborhood facts

weather (right now in New York)

style guide
- buttons
- sliders
- profiles
- callouts

color palette
- background
- text, etc
- color guide for riders

map
- neighborhoods
- photo share

poster
- data comparisons
- statistics
- over time
- distance
- hood info
- progress over time

global elements
- header
- footer

Brand name: The name of your company or service.

Overview: A short overview of your brand‘s personality. What makes your brand personality unique?

Personality image: This is an actual image of a person that embodies the traits you wish to include in your brand. This makes the personality less abstract. Pick a famous person, or a person with whom your team is familiar. If your brand has a mascot or representative that already embodies the personality, use that instead. Describe the attributes of the mascot that communicate the brand’s personality.
–curious, charming, practical, quirky, playfully competitive, approachable, unassuming, classic, simple, intriguing, in touch with the city as a local with facts, witty, chill, driven, respectful, Bill Cunningham, Stephen Fry, Jamie Oliver, Anthony Bordain (Eataly), daring, Gorilla coffee, sophisticated.
Not: Intense, bossy, show-offy, insistent, two moon.

Brand traits: List five to seven traits that best describe your brand along with a trait that you want to avoid. This helps those designing and writing for this design persona to create a consistent personality while avoiding the traits that would take your brand in the wrong direction.

Personality map: We can map personalities on an X / Y axis. The X axis represents the degree to which the personality is unfriendly or friendly; the Y axis shows the degree of submissiveness or dominance.

Voice: If your brand could talk, how would it speak? What would it say? Would it speak with a folksy vernacular or a refined, erudite clip? Describe the specific aspects of your brand’s voice and how it might change in various communication situations. People change their language and tone to fit the situation, and so should your brand’s voice.

Copy examples: Provide examples of copy that might be used in different situations in your interface. This helps writers understand how your design persona should communicate.

Visual lexicon: If you are a designer creating this document for yourself and/or a design team, you can create a visual lexicon in your design persona that includes an overview of the colors, typography, and visual style that conveys your brand‘s personality. You can be general about these concepts, or include a mood board.

Engagement methods: Describe the emotional engagement methods you might use in your interface to support the design persona and create a memorable experience. We‘ll learn more about these in the next chapter.

Thesis Advice, v.1

“Ambitious: (of a plan or piece of work) intended to satisfy high aspirations and therefore difficult to achieve.”

While ambitious describes us pretty well, Kristin and I have been both lucky and blessed to have a handful of advisors on our thesis project. Between five consultation meet-ups, we’ve been exposed to many different approaches for the next 3 months that could lead to very different ends (or milestones) in May. While our brains have flooded with the possibilities, below I’ve called out the sticking points.

THE MYTH OF OUR PLATFORM
Advice from Willy Wong
Two of the most important things we can do with our thesis project is to sell our idea, and to sell the lifestyle of biking. Manufacturers of lotion believe that if you just try the product once, you will love it so much that you will keep buying it. If we get people to bike once, is that enough to keep them biking?

Willy encouraged us to think about what the front page of the site looks like on day 1, versus day 2, versus day 4, versus one week later, and so on. What exactly does the service do from the initial sign-up to keep a rider engaged and motivated to ride? And how do we continue to keep people engaged once they’ve hit a plateau and are bored of tracking?

We’ve started to explore a 2-week challenge model, with the option to continue tracking and visualizing bike rides afterward. In this case, our primary user base would use the service like a ‘training program’ for two weeks to get in the habit of riding a bicycle for transportation. We suspect that a few advanced users, mostly data enthusiasts, quantified self fans, or committed storytellers, would use the service long-term.

But, the question remains: how do we get people to exclaim, ‘I can’t live without this’? How do we get people addicted to biking and addicted to telling their story by painting their city on two wheels? What do we tell them?

Willy has poked holes in our concept and given us tips and frameworks for getting started with branding and moving forward with user experience and concept development.

OPEN DATA FOR GOOD, NOT EVIL
Advice from Amit Pitaru
Amit encouraged us to take a strong stance on our world view in regards to data—OPEN: our users have complete ownership over their data; or CLOSED: we sell the data to large companies for marketing. Both models are viable and are being used by businesses today. Though, we mainly discussed the possibility of having an open source model. Analogues include OpenPhoto (openphoto.org and openphoto.me) and WordPress (wordpress.org and wordpress.com). With both of these, there is a side to the model that offers a service, and a side that is open for developers to build their own service upon using their own data and coding skills.

We believe in data for good. Our users should own their own data. In addition, we see a lot of power in using the mapped riding data to advocate for biking and to show NYC DOT where to paint bike lanes. Regardless of how we set up our business model, we value data ownership with the option to share anonymously for the public good.

TRACKING AND FUSION TABLES
Advice from Robert Carlsen
We met with Robert Carlsen, the developer of Mobile Logger, a tracking app for bikers. He developed the app as a part of his thesis at ITP nearly two years ago. Needless to say, he understands the joys and decisions involved with graduate thesis projects.

We were (and still are) impressed with his work, and were excited about the possibility of building of top of his open-source tracking platform. It’s funny that his first recommendation was to ‘not use Mobile Logger’. Not because he didn’t want to share, but simply because it’s two years old and he believes there are much better ways for developing a tracking app now.

In short, we have options for development—some including the Mobile Logger and some excluding it. However, rather than building the entire platform (tracking app and web platform) right away, we’ll first focus on an initial prototype for testing the idea within our short 3-month time period. After meeting with Robert, we’ll look into how Google Fusion Tables can help us collect and store data as well as other iphone tracking apps.

Yes-No Brand Personality

After having a look at the brands that our target audience uses, we’ve decided on some traits that we want to embody:

PLAYFUL BUT NOT CHILDISH

BEAUTIFUL BUT NOT FEMININE

STYLISH BUT NOT TOO HIP

INFORMATIVE BUT WITH PERSONALITY

KIND OF LIKE VIMEO

OR LIKE GORILLA COFFEE

Target Audience

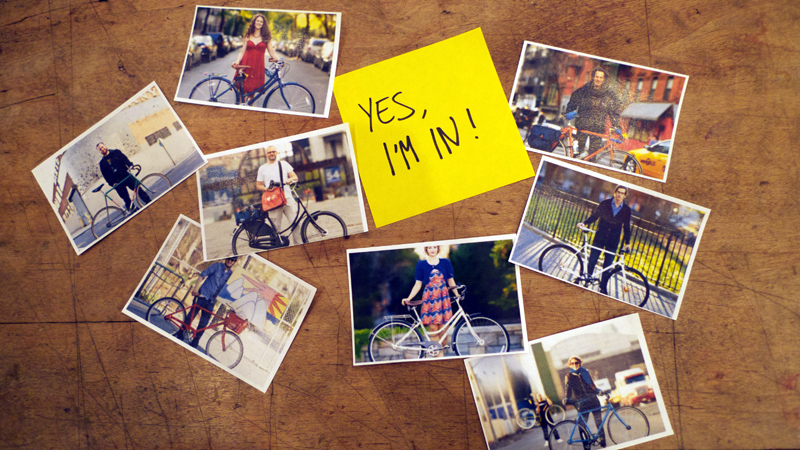
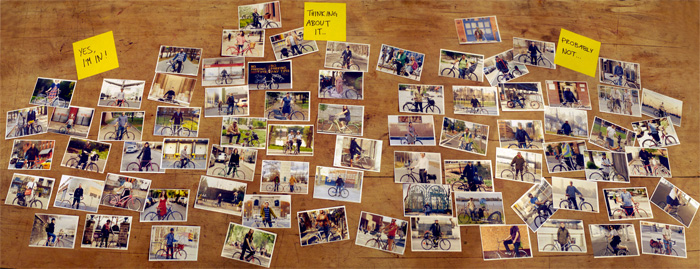
We took a good look at all the wonderful #BikeNYC portraits by Dmitry Gudkov. Then we tried to guess who is likely to use our product. This is plainly based on this one small paper version of a portrait photo, silly stereotyping, and us imagining what kind of person this possibly could be. We even made up stories of some in order to place them right on our sliding scale. “Would this person have a smart phone?”, “Does this person even care about tracking?”, “Is this person too hip, too old, too busy, too …?”. It’s far from scientific, but it definitely helped us thinking of who will be key users of the Paint Your City platform.

By the way, this is true for all the photos except one, as we actually met the amazing Julie (blogger and commuter on a Linus) on the Tour de Taco last year. You might notice that we secretly hope she will be painting her city from her bike :) Click on the image below to see all portraits placed on the axis of most to least likely to use our service.

Brand Landscape

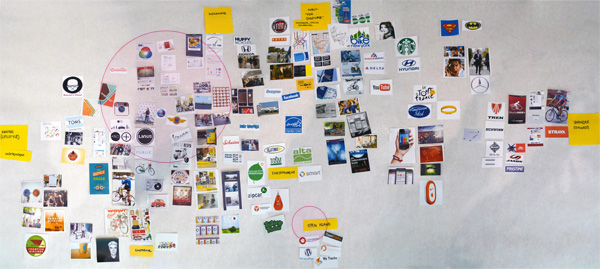
Through using Gimmebar, we have collectively captured a bunch of brands that are either competitors, we want to be similar too, or that we believe influence current bikers, potential bikers and so on. We also added some pure visual inspiration. We went after keywords like fitness, tracking, environment, bikes, transportation, social, lifestyle, nostalgia. When laying the cut-outs out on a table, we tried several different axes for structuring. In the end we were happy with the lifestyle vs. fitness axis, but the other yellow stickies became more like their own little islands, than a continuum.

Either way, we agreed that we are definitely closer to the lifestyle than the fitness space, that our brand should be somewhat creative and “designy”. It should be a Vimeo rather than a YouTube. It will appeal to creatives, but not be over the top hipstery, as we do not want to alienate the masses.

Our brand should feel informational (Feltron-style), though our target audience will not be athletes with $10,000 bikes that care about all kinds of very accurate, detailed data about their rides from a fitness perspective (heart rate, cadence etc).

We believe our target audience could be riding quite a lot of different bike types (road bikes, fixies, cruisers), but think that our brand very well could adapt the clean style of the Abici or the Public bikes. We hope to attract even the people that care about the stylish, old-style Pashleys or Gazelles with fancy baskets, leather saddle and all that, but we don’t dare to go in a too romantic, nostalgic direction with the brand.

Finally, we are flirting with the idea of an open source platform, which in itself will inform how the brand is perceived and how it appeals to more “geeky” audiences. We have not reached a decision on this yet, as we’re still researching various ways to go about when building the platform.

From Mr. Carlsen

Notes per our conversation with Robert Carlsen
January 27, 2012, Champignon Cafe

ON MOBILE LOGGER
Robert does not recommend building on Mobile Logger. But he is willing to give us the API code so that we can use it and have rides automatically uploaded to our own server if we want to use it for prototyping.

For a database, Mobile Logger is using Couch DB
- ride data is sent as JSON object to Couch DB, then transformed into document
- API (written in Ruby) pulls data from Couch DB
- Note: ride data is not associated with a user; you need the phone ID number to associate a user with their data
- Data is visualized in the web browser (using R)

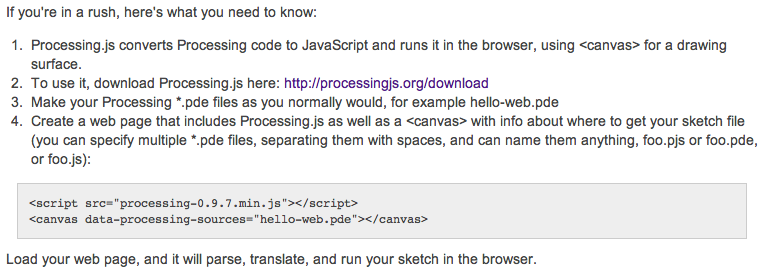
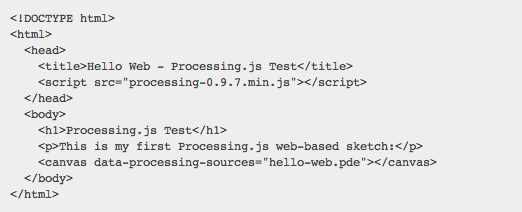
If we used Mobile Logger code, we could use processing.js, but would need to write a script to reformat the data.

SUGGESTIONS
Look into Google Fusion Tables instead of a database (gather, visualize and share data online)
- visualize and publish your data as maps, timelines and charts
- host your data tables online
- combine data from multiple people
Google My Tracks publishes to google spreadsheets (only for android)
If we used Fusion Tables, we would need to write code in his existing code to connect Mobile Logger to Fusion Tables.
We can import any data into fusion tables (it seems)

Other tracking options:
- Training Peaks Cycle Tracker
- Golden Cheetah
- Bike Nik
- more…

Inspiration: NIKE Signature Moves posters

FURTHER
Our basic needs for tracking:
- iphone compatibility (necessary)
- android compatibility (preferable)
- export ride data from phone after ride (at least via email, at most to fusion tables or database)

Side Research on Google Fusion Tables:
- test styling of google maps
- how do we import data to fusion tables?
- collaborative sharing vs. private sharing on the same map? etc.
- what are our viz capabilities with google maps? can we use a description like “rain” and filter rides for the viz based on that

From Willy Wong

Notes per our conversations with Willy Wong
January 20, 2012, NYC & Company
January 25, 2012, SVA IxD Studio

AUDIENCE
Who is the right group?

Broad appeal: who will use it right away?
What do you get out of using it—when you first start playing vs. over time?
What happens at the plateau? When users get bored?
On point of boredom: what are the users relationship to other people; community and interaction keeps people engaged; it’s more about the community/interaction than the solo service you’re providing
Think about the look of the page on day 1, vs. day 2, vs. day 4, vs. a week later, vs. a month later

Theory of fun
Look at what other systems are doing to incentivize people (ex: coffee, airlines)

Size of audience: what % of bikers are interested in using it
Bike share would guarantee new users; wouldn’t be sustaining users over a long period of time

BRANDING
Map a landscape of visual language of related services and biking (trek vs. linus; sports in relation to biking; foursquare, gowalla, etc.)
Decide where you fit in the spectrum of visual language
Think about:
- color vs. industry type
- typography: griddy urban vs. athletic, etc.
- info design

Build mood boards to rationalize why it makes sense for your brand
status in types of bikes: lifestyle palette, taste
status in going places

SELLING BIKING
How do we make people say, “I can’t live without this!”
How does the service cause people to overlook the barriers?
What are you selling?
What is the myth of the platform?

We need a fun aspect in the manifesto!
How could I convince you to start roller-blading for transportation? Or the ferry? Or a moped?
- Think about how you would convince someone to take different alternative modes of transportation.
Notes: it’s less hassle than you think, it will make your life easier, you will get fresh air, it will make your life better, the chair will stop killing you, it’s easy to own a bike and take care of it and park it, it’s comfortable, you will feel free, like you’re flying

Check out NYC bike month campaigns

Statistics, what is our correlation between behavior and information?
Does awareness of information compel someone to take action?

How does an old piece of technology survive in a world full of new technology?

IS IT A BIKE DAY? (AND TWITTER BROADCASTING)
Tweet when you get on your bike
If we need someone to check the app every morning to see who’s riding
If a biker has to check the app every morning to see who’s riding, then give them a reason to check.
Note: giving clever weather reports are a good reason

We need the right media to deliver the message
Maybe it’s a clock that spins faster when more people are riding
What is more buzzworthy?

What do we need to develop to compel people to bike more?
Ex: Lotion, “if you try this, you will like it so much, you will buy it again”

AUDIENCE
How many people own a bike?
How many people use a bike?

For clients of a service, consider: acquisition, retaining, servicing.
Typical marketing question: How do you acquire them, retain them and service them?

Maybe the majority of our users only use the service once or twice? They participate in 2-week challenges as a way to get motivated to ride. A common analogue is Weight Watchers. It’s a program with a triggger for action and a prize at the end. We may still have super data and designer nerds that want to keep using the service as a record-keeping or journal tool.
Imagine the use cases.
Size up the market.
- how many people are riding in NYC (from DOT)
- talk to bike shops to see about how many customers they serve

Separate the movement and scaling audience from having a product that allows for scaling; it costs money to run the business (per user)

TAGLINE
Map/Record
Art
Bike
Social
Think of analogues for our key concepts. What happens if they have a baby? What does that give you? How can we use things that are familiar to our Grandma to explain what we are doing?

Our Bike Manifesto

HUMAN SUPERPOWERS
Once upon a time, far from now, bicycles were a novelty. Claimed as a gift of science to man, these human-powered machines charmed the adventurous. At the turn of the 20th century, men strapped on their suits and women pulled up their bloomers to ride. These vehicles transformed one’s puny strength into something greater—mankind finally found its’ superpowers, and women in particular found their freedom machines. The bicycle saddle became a lot of people’s primary seat for getting from the suburbs to the inner city to do work.

SOMETHING HAS BEEN LOST
Today, for some people riding a bike from the suburb to the city center is plain out impossible. Today, American cities are built for the automobile. The concrete streets and interstates that link neighborhoods have, in many cases, caused unsustainable and lousy living. Today, we are so much ingrained in the car culture; it’s hard to imagine having it any other way.

NYC IS DIFFERENT
Thank goodness, New York City is different. New Yorkers heavily rely on public transportation and their own two feet to get around. Thanks to the efforts of Janette Sadik-Khan, our city increasingly becomes more bike-able. As Commissioner of the Department of Transportation, she has been painting New York with beautiful green bike lanes since 2007.

PAINT YOUR CITY
We are determined to help Sadik-Khan paint our city. Well. Not literally with green paint all over our hands. However, we are head over heels dedicated to get more people riding on the streets. Instead of using paint, we are giving New Yorkers a color to track their rides on a map. Seeing your own bike rides on a map reveals your bike habits. Seeing your friends bike rides on that map, makes you want to beat them. Or join them. You decide. Either way, you’ll be surprised by how far you can go, as well as inspired by all the places you have yet to conquer.

EXCUSES, EXCUSES…
We’ve heard all the excuses. Seriously, all of them:

“I don’t want to give up my morning bagel routine.”
“I have to wear a suit to work.”
“I don’t want to mess up my hair.”
“It’s so much effort to pack gear everyday.”
“I don’t have room in my apartment for a bike.”
“My bike is so nice, I don’t want it to get stolen in the city.”
“Manhattan terrifies me!”

Honestly, we don’t disagree with any of them. Getting in to the habit of biking is hard at first. We know, we’ve been there.

WE HAVE A SECRET
“Can I really do this?” This was the question we first asked ourselves. We were open to it, curious and felt a little challenged by it. Or a lot. It is this very curiosity that will lead you to discover your human superpowers–just like the men in suits and women in bloomers at the turn of the 20th century. Once you just try it out, we can assure you that you’ll never regret a ride.

A COLOR, A STORY, A VOICE
Your rides have a color, they record your personal story, but they are also a voice in the grander scheme of biking. You and only you own your data. However, by sharing your rides anonymously, you will along with the entire bike community have the power to make New York City more bike-friendly.

From Amit

Notes per our conversation with Amit Pitaru
January 23, 2012, Kitchen Table Studio

DATA FOR GOOD VS. EVIL
Which route do we take: OPEN Own your data vs. CLOSED We sell your data to large companies for marketing

See HackerNews for startup models
37 Signals—builds things people want, then charge money for them
this doesn’t happen in a lot of cases anymore

Two different movements of open source: good (use for good) vs. evil (sell to companies)
Decide your world view on data

OPEN
Own your own photo data: Openphoto.me and Openphoto.org
“If you’re not paying for something, then you’re the product being sold.”

One option: Have an open API for developers then offer our own premium service.
Example: WordPress.com and WordPress.org
With this open API:
- devs can use their own data for their own apps
- people can give their friends access to their data
Do this kind of open thing, but have a service too; it’s important for us to have a service

Open it up, let people see what they can do.
Need:
- landing page
- sign-up page
- state intentions
- the specific services
- 1st code repository (on github)
- build a device to track data recorded (phone)
- API can fish out data
- allows you to get your data
- and you’re friends data (with their permission) on top of it
- every person has an account, that’s how they access their data
We would have user accounts with system on top that allows you to get your data and friends data on top of it.
Data for good: Convince people to give their data to us for bike advocacy

OPTIONS FOR GETTING DEVELOPERS
1. Get investment
- seed money
- investors
2. Kickstarter
- landing page, shows how well thought out the idea is
- need money
- interested in tech co-founder
3. Hack day
- open source project landing page, call to action
- mock-ups
- invite devs to hack together, treat them well with coffee and cupcakes
- start gathering data
- get DOT or bike shops to sponsor

RESOURCES
appannie.com—see how well apps have been doing