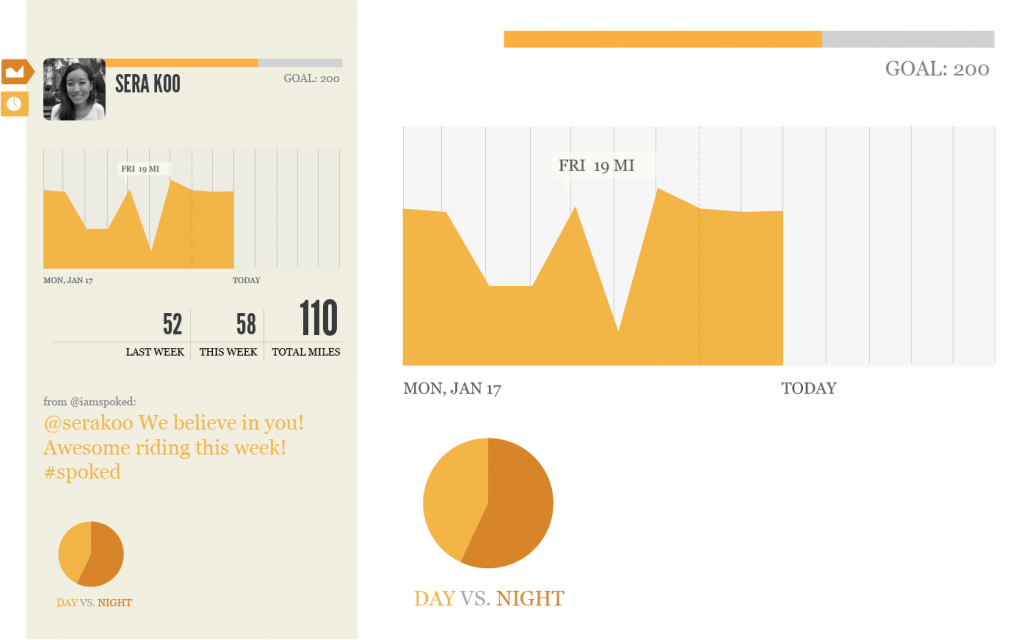
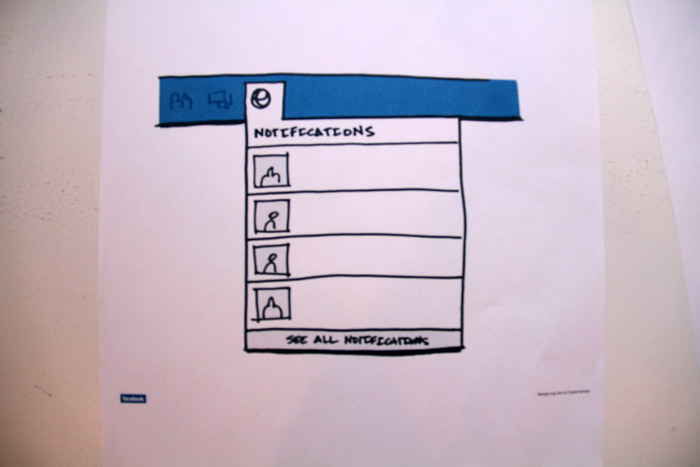
We’ve been struggling with what it is that makes people keep coming back to our product. And so, Liz shared with us Joshua Porter’s article on Designing for the Social Web: the Usage Lifecycle.
Author Archives: Carrie Stiens
Prototype Roundtable Notes
This is what we told our critics:
Our aim is to motivate people to ride bikes.
Our hypothesis is that when you can see where you have been on a map, you will be inspired to go more places.
Our value for the individual is making a record of your life on a bike. If you have friends on the platform, the value added is to compete, be inspired, or collaborate on a map. We also shared with them our working prototype.
The feedback we received:
FROM PAUL PANGARO
“It’s both a 1 person video game and a 2 person video game” – Cooper
If it’s about comparing, what choices are you making about how you are showing comparisons—what mechanisms are you using
Ex: velocity vs. acceleration (velocity is how fast you are going, but acceleration is the rate at which you are increasing)—If I’m beating Kristin, at what rate am I beating her; can I compare how well I’m beating her this week to last week?
We should be able to say “I chose this because…”
FROM FRANK CHIMERO
The overlap is interesting
Is it about documentation or being inspired?
How are we incentivizing people?
Typography on maps
Documenting vs. information
- how do you make the data information
- contextualize it
Tell a few stories of how it’s used
FROM AMIT PITARU
What makes people want to keep coming back to use it?
TAKE A WORLD VIEW
“See your snazzy patterns emerge on a map” is not enough —amit
Is it only about seeing?
self-expressing
- it’s telling you where you have been in your city and how often you ride; it says something about you
Your bike habits say something about you.
What we’re making: Uses the rides you take on a bike as a form of self expression.
- How do people react at a party?
Charts & Graphs in HTML 5
Along with showing your snazzy bike patterns on a map, we’ll give riders extra insight into their habits with beautiful charts and graphs. I’ve been doing research as to how we can make these using the HTML 5 canvas element and Javascript libraries.
Recently, I thought we should use g.raphel javascript library. From the looks of it, you can draw vector graphics in the browser! That’s pretty exciting, right. The problem is that, while there is documentation, there’s not any tutorials to get us started. So, I began to look into other options.
We can actually draw pie chart and line graphs within the canvas element without needing a plugin or javascript library. Here are a few good tutorials for getting started:
Creating Line Charts using HTML 5 Canvas from Weblogs.
Draw Line Graph using HTML 5 Canvas from World Wide What
Create a simple pie chart with HTML 5 Canvas from Yojimbocorp
How to Make a Pie Chart from Wickedy Smart
The two additional options I recommend are using processing.js, which we are familiar with, or PlotKit, which is a chart and graph plotting library for Javascript that is very well documented.
Sharing Story, Facebook
We had the folks from Facebook join us at SVA for a workshop Saturday morning. So, with the help of our classmate, Benjamin Gadbaw, we imagined how SPOKED could be shared through a Facebook app.
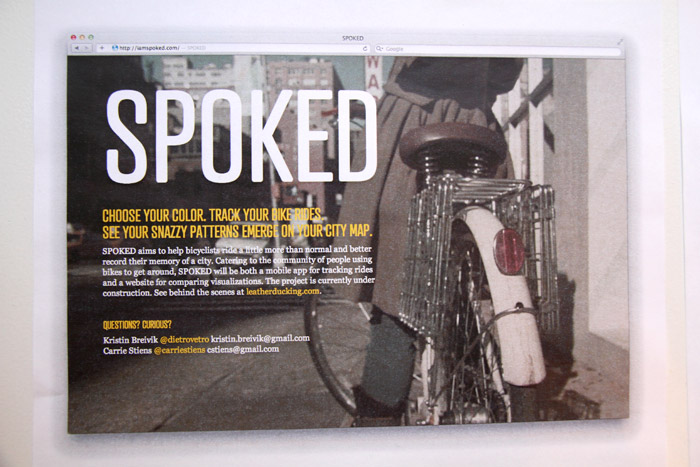
SPOKED Choose your color. Track your bike rides.
See your snazzy patterns emerge on your city map.
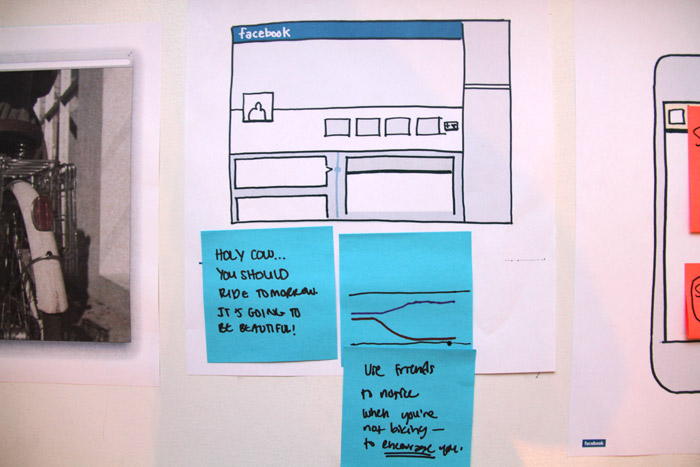
In her Facebook timeline, Kristin sees a comparison chart between she and her friend Carrie. While she has been consistently riding, she notices that Carrie has been consistently slacking. It hasn’t even been raining lately. She wonders what’s keeping her off.
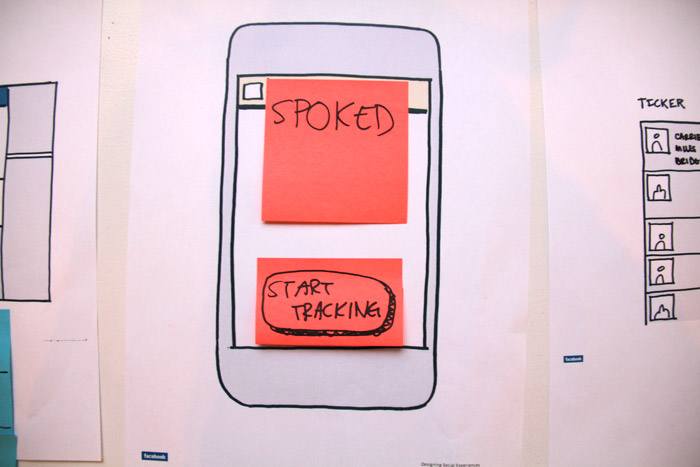
Kristin comments on the chart to encourage Carrie saying, “Holy Cow! Carrie, you should ride tomorrow! It’s going to be sunny and beautiful!
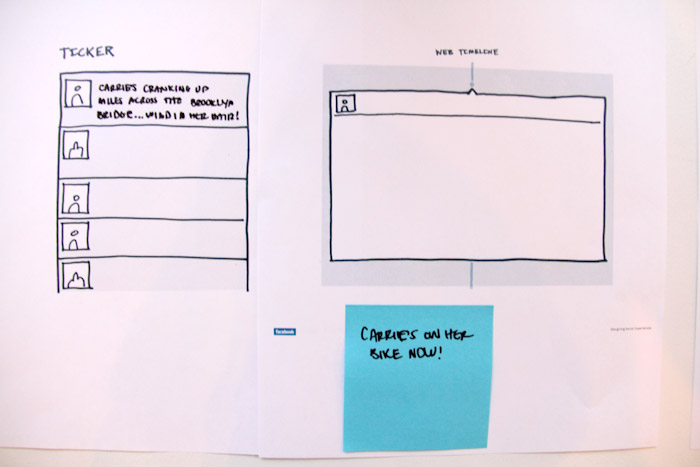
When Carrie sees the message, she goes to the SPOKED website to see what’s been happening on the streets of New York lately. Her friends have been taking their typical commutes to work and it looks like a few rides to the park, but her personal map is completely blank. She thumbs through some archives, because she knows she’s done better in the past.
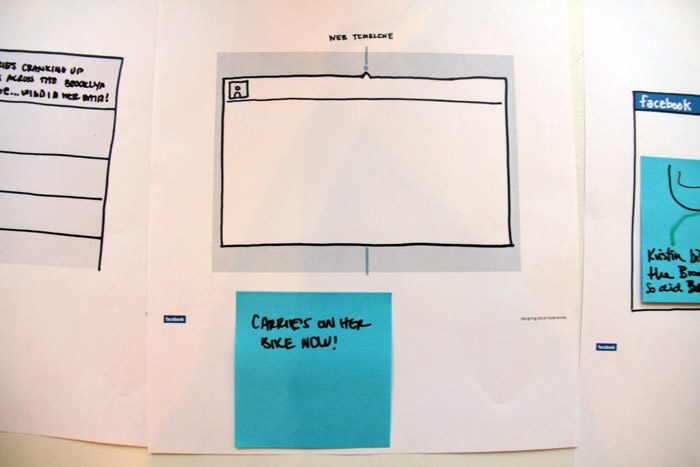
The next morning, even though she’s fallen off the boat, Carrie is determined to make some marks on her city. She ditches the subway and the coffee routine she recently fell in love with, and wrestles her bike out of her tiny apartment.
She starts tracking on her SPOKED app before taking off. She’s got to prove to Kristin that she can do it. While she’s had a couple weeks off, she feels pretty good to be on two wheels again. Not to mention, the two hours of fresh air, make her so happy!
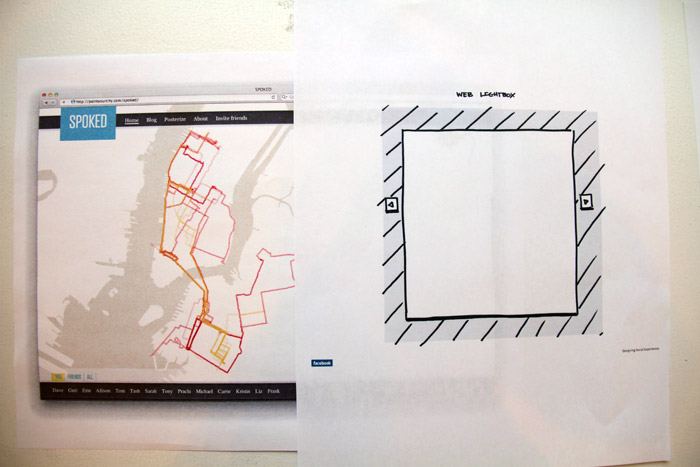
Kristin sees in her ticker that Erin is on her bike cranking up miles across the Brooklyn Bridge. She smiles and sends some encouragement her way.
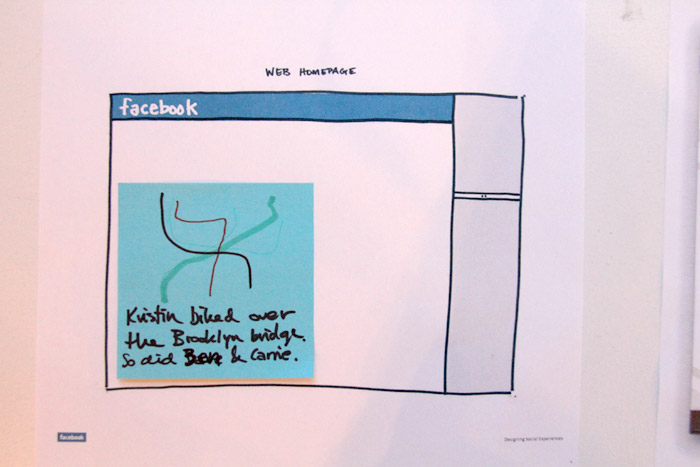
Later that day, SPOKED shares with the biking community that Kristin and Carrie both biked over the Brooklyn Bridge this morning. The story is paired with a photo of their paths.
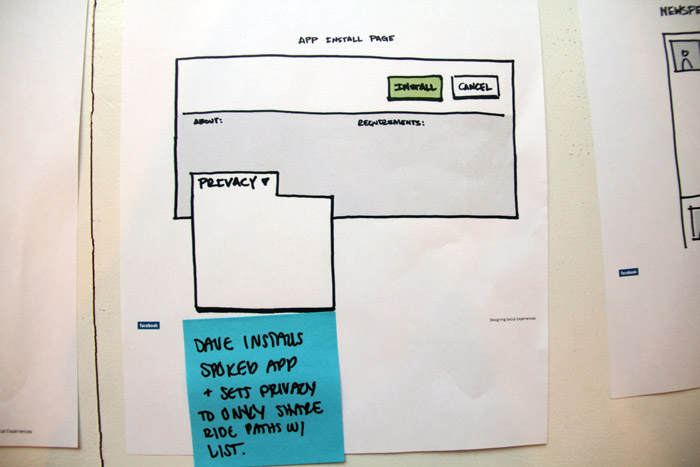
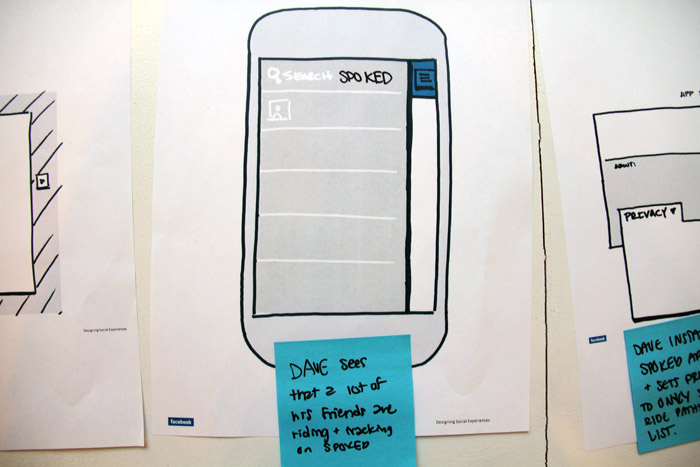
Dave, a former colleague takes notice. He wonders, “What is SPOKED?” He actually sees that a lot of his friends are riding bicycles and tracking on SPOKED. He decides to join and give it a try.
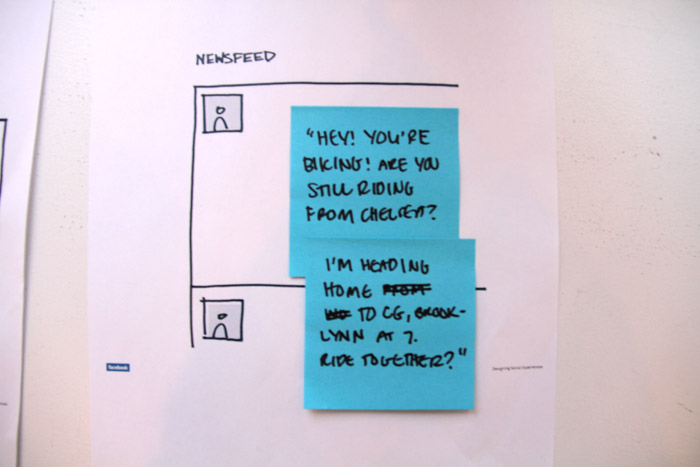
The next day, Carrie sees a notification that Dave joined SPOKED. She’s excited, and writes to him the next day, “Hey! You’re biking! Are you still riding from Chelsea? I’m heading home to Carroll Gardens at 7pm. Ride together?”
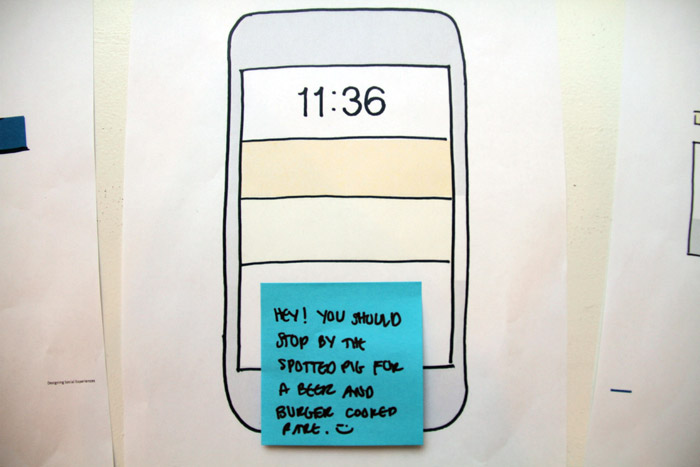
Carrie and Dave ride home together that evening. Mid-ride, while stopped at a red light, Dave gets a message from Paul. “Hey! You should stop by the Spotted Pig for a beer and burger. They are both deliciously fabulous there.”
They decide to stop and reminisce on the good ‘ole sleep-deprived days of grad school, and toast to having a life again.
Tracking Instructions Google My Tracks
You don’t need to pre-set anything for My Tracks. Just be sure to send from the right email address, once you start sending rides. Also, there are a few steps to go through to send the ride data to us. See below.
TO START TRACKING:
Press Menu “Record track”
TO STOP TRACKING:
Press Menu “Stop recording”
TO SHARE:
1. Press the … button
2. (Under This track) Select “Share with friends…”
3. (Under Share with friends) Select “A GPX file”
Google will tell you this will take a while
4. (Under Share track using:) Select Mail
Be sure to send the email from the email address you gave SPOKED when you signed up. If it’s not the same, press “From: ” and select the correct account to send from.
5. Send email to: yes@iamspoked.com
You don’t need to change anything in the subject or body, just press “Send”.
That’s it. Easy Peasy!
Processing Status
FEB 16
I have a basic processing sketch rendering in the browser (Firefox). However, the geo-data is not rendering in the browser yet. The solution? Start with a very simple processing sketch that plots one ride, then start building from there. Also, call Yang, Amit or Jer Thorp.
FEB 15
- learn how canvas works
- sprinkle in codeacademy tuts
- get one ride rendered in processing to show in the browser (data?)
Resources:
Loading processing sketches
Processing.js example, Ask Ken, doing much of what we want on the front-end
Elevation processing code
Basics of Canvas—Processing.js is a framework for canvas, so we shouldn’t have to do additional things in the web-browser defining the canvas; it’s all done in processing.
FEB 14
Simple processing sketch works in Firefox and Safari
Note: sketch does not work in Chrome, but could later with some troubleshooting with the help of ErisDS; for now, we will test primarily in Firefox.
In dropbox >> thesis >> processing >> hello_web >> hello-web.html
One map image is ready to test in processing.
Does not display the image when image is native to the processing file. Need to research. (I think the image should be displayed in HTML)
Next steps:
- get image to display
- get canvas element to display over the entire background
scale canvas element to fit page: Stackoverflow, Automatically scale the HTML5 canvas element to fit the page
related: Stackoverflow, Center both vertically and horizontally
- start experimenting with width and height options to size with browser size (determined in processing or in canvas markup)
Possibly something like this in Processing:
size(DeviceSettings.view_width,DeviceSettings.view_height);
- look into centering the map on the page
Data Storage Options
GOOGLE FUSION TABLES
250 MB storage limit per user account, 1 million characters per cell
upload limits—1 MB per spreadsheet, 100 MB per .csv or kml
To get more space, you have to have and work through the Maps API Premier account
Purchase more storage space for Fusion Tables: Google Groups Thread
How to query from google fusion table: Google Dev Guide
CLOUD MINE
Get data storage, user accounts and server-side code with Cloud Mine
FILES ON OUR OWN SERVER
Instructions for parsing data from a .gpx file into processing
Thoughts in Progress: Values, Tech, Splash Page
Our thought progress after meeting with Willy on February 2, 2012:
VALUES OF OUR RIDERS
1. Altruism & Social Good
selfless concern for the welfare of others
2. Naturally Active Lifestyle
healthy lifestyle, efficiency
“We bike, of course”
3. Adventure & New Experiences
openness to new places and things
love for a place, hunger for life
“Life’s too short for monotony”
4. Connecting with People
sharing life and lifestyle
5. Expressiveness & Creativity
having style
good design, quality products
6. Independence
free of systems and institution
BACKEND TECH
- automate data transfer from email to server
- parse data for processing
- activate processing to render
- display various views: aggregated, groups, individual
- compile stats (ex: distance, time spent riding, neighborhoods covered)
- map views (Brooklyn, Bronx, Manhattan, Staten Island, Queens)
- twitter feed
- notifications for achieved milestones (ex: riding 100 miles, riding for consecutive days, tracking, coloring hoods) and needed encouragement (ex: not riding)
SPLASH PAGE
Name
Tagline
Short Description
1. Choose your color
2. Bike Persona
- Neighborhood Warrior
- Casual Commuter
- Committed Commuter
- Strictly for Pleasure (Leisure Rider)
3. Reserve username with Twitter (or leave email)
BLOG
- Want 6-10 stories by May based on interviews with bikers
- Get a photo of bikers
- Choose meeting points for each biker
- Tie string on handlebars
Interview Questions:
- Tell us about the places you go on your bike (favorite, where you meet people, latest ride)
- What is your take on weather
- Do you try to get your friends to ride?
- Any strange encounters?
- Goals?
From Willy Wong, Week 3
Notes per our conversation
February 2, 2012, NY & Company
VALUES
Call out the key principles/values that our audience stands for. (ex: lifestyle, pleasure)
State the value propositions:
For riders
- document of bike trips
- share your data for bike advocacy
- engine for exploration and curiosity (needs to be better stated)
Business
- data to advocate for and inform placement of bike lanes
- (more)
The string on the handlebars—a grassroots signifier of riders being involved (using the product) and tracking
NAME
Consider the order and architecture of the language we’re using
Is everything mapped to an artistic act?
What do you call your users?
Concept & Branding
STYLE GUIDE ELEMENTS
title
logo
tagline (baby)
service offering
copy nuggets (commentary)
- weather
- how you’re doing
- what your friends are doing
- neighborhood facts
weather (right now in New York)
style guide
- buttons
- sliders
- profiles
- callouts
color palette
- background
- text, etc
- color guide for riders
map
- neighborhoods
- photo share
poster
- data comparisons
- statistics
- over time
- distance
- hood info
- progress over time
global elements
- header
- footer
Brand name: The name of your company or service.
–
Overview: A short overview of your brand‘s personality. What makes your brand personality unique?
–
Personality image: This is an actual image of a person that embodies the traits you wish to include in your brand. This makes the personality less abstract. Pick a famous person, or a person with whom your team is familiar. If your brand has a mascot or representative that already embodies the personality, use that instead. Describe the attributes of the mascot that communicate the brand’s personality.
–curious, charming, practical, quirky, playfully competitive, approachable, unassuming, classic, simple, intriguing, in touch with the city as a local with facts, witty, chill, driven, respectful, Bill Cunningham, Stephen Fry, Jamie Oliver, Anthony Bordain (Eataly), daring, Gorilla coffee, sophisticated.
Not: Intense, bossy, show-offy, insistent, two moon.
Brand traits: List five to seven traits that best describe your brand along with a trait that you want to avoid. This helps those designing and writing for this design persona to create a consistent personality while avoiding the traits that would take your brand in the wrong direction.
Personality map: We can map personalities on an X / Y axis. The X axis represents the degree to which the personality is unfriendly or friendly; the Y axis shows the degree of submissiveness or dominance.
Voice: If your brand could talk, how would it speak? What would it say? Would it speak with a folksy vernacular or a refined, erudite clip? Describe the specific aspects of your brand’s voice and how it might change in various communication situations. People change their language and tone to fit the situation, and so should your brand’s voice.
Copy examples: Provide examples of copy that might be used in different situations in your interface. This helps writers understand how your design persona should communicate.
Visual lexicon: If you are a designer creating this document for yourself and/or a design team, you can create a visual lexicon in your design persona that includes an overview of the colors, typography, and visual style that conveys your brand‘s personality. You can be general about these concepts, or include a mood board.
Engagement methods: Describe the emotional engagement methods you might use in your interface to support the design persona and create a memorable experience. We‘ll learn more about these in the next chapter.
